Has it really been over a year since I wrote my last blog post? Wow, that's
embarrassing. Well, I'm going to do a post recapping my CVSI trade, a record-best $212,000 gain for me, because there are so many great lessons
to be learned from it. I would have recorded a video, but given the fact
that everything microphone-related I own is now either broken or in
Puerto Rico, I have little choice.
There
are really two sides to discuss when it comes to CVSI, the technical
side and the fundamental side. Yes, the "Trading Tickers" guy has
finally started looking at fundamentals. I've spent the last couple of
years slowly improving my ability to read SEC filings and understand their
significance, although I'm sure that I still have a long way to go. But
in this specific case, the basic fundamentals I saw, combined with the
technical chart setup on CVSI, led to one of the most picture-perfect
long setups I've ever seen.
The Technical Side:
Does
the term "Multiday Breakout" sound familiar to anyone? I hope it does,
because it's one of the only long setups I've ever been good at or done
videos and posts on.
If you're looking at just the one year chart, CVSI's
breakout was above the $.89 level, set on 4/26/18.
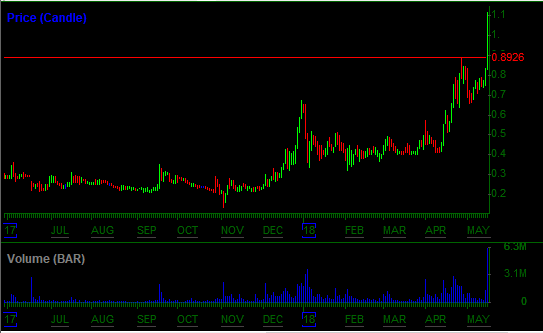
But if you go back a
bit further on the chart, you'll see a beautiful multi-year high right at the
$1 level.

Yes, the chart goes back further and there is more overhead
resistance (back when the ticker was CANV), but given the complete lack of volume on those trading days,
those levels hardly concerned me at all.
I
was a bit late seeing CVSI. It was on my OTC scanner, but I hadn't paid
much attention to it because I was busy frustrating myself by trying
to short HEAR and BLNK. I think it was eventually a tweet from
@InvestorsLive or @OddStockTrader that made me take a closer look. I saw
it coming up on the $1 breakout level, and I was very interested in
longing it, just as I would be any other OTC stock. In fact, my first
buys were right around $1 on May 15, as the stock was breaking out. I
also added some shares into weakness on pullbacks and finished the day
long 50,000 shares overnight.

I expected a
gap up and further spiking the next morning, but instead, CVSI gapped
down and pulled back under $1, where it consolidated for two days.

The
stock was weak, it was red on the day, it wasn't continuing. Why didn't I
just get out and move on? Well, I've been noticing lately that the OTC
breakout pattern seems to be evolving a bit. In the past, I would have
cut on a g/r move like this. But lately, I've been seeing a new pattern
emerging - a shakeout g/r after the first breakout day and then recovery
and continuation. It seems that more and more breakouts are doing this.
More importantly, this red shakeout still seems to hold the original
breakout level area, despite being red on the day (in this case, the
$.90 area). So I adapted, and I've begun to reconsider risk levels I
will use on day 2 of breakouts. It also helped that my average was
around $1 and that I hadn't chased the spike up to the $1.12 closing
price. In fact, I actually used these days to add to my position, and
I wound up long a total of 159,800 shares from a $.986 average.
The
only other thing really worth discussing on the technical side is my
decision to sell. I was very patient with this play, mostly for
fundamental reasons, which I'll discuss next. But also, I do know that
breakouts can go parabolic, and I did believe it was possible the CVSI
action could speed up. When that finally happened and the chart started
to get extended near $2, I figured my time had come. I didn't want to
hold through a giant parabolic, sit through a crash, and watch a huge
gain disappear. I would then likely be stuck in a situation where I'd
have to wait weeks, if not months, not knowing for sure if the stock
would ever rally again. That didn't sound fun. So I paid myself 1/4 of
my position on June 4 and took off the rest on June 5. I mostly paid
myself into strength, taking off in chunks of 5,000 to 10,000 shares
at a time. My average overall exit was $2.317.

The Fundamental Side:
-Shares outstanding:
90,512,563
-Current assets: $9,541,937
-Total assets: $23,054,414
-Total liabilities: $5,018,468
-Stockholders' Equity (assets - liabilities): $18,035,946
-Product Sales (Revenue): $8,070,765
-Net Income: $619,334
-General quick-search through 10-Q for possible ways for the company to dilute and increase share count
While
there is definitely much more information you can learn by reading a
complete 10-Q or 10-K, the above info was more than enough for me and
took me just a few minutes to find. My first reaction when looking at
this was a bit of shock, due to the fact that the financials looked
better than most listed stocks I research. It's pretty rare for me to see
a small-cap company with positive net income. With revenues also above
$8 million, it was clear that this company actually has and sells a real
product. For once, I wasn't trying to buy a blatant pump.
From
there, I looked through a few other things to get a clearer picture of
the fundamental side. I looked back at the previous three quarterly
reports to see what revenues and net income looked like. I quickly
scanned twitter and the Ihub message board to see if anyone had anything
intelligent to say about the company (and ignored the "TO THE MOOOOON"
garbage all over the place). A few quick highlights of things I noticed:
- Revenues were steadily increasing every quarter, so the most recent quarterly statement obviously wasn't a one hit wonder.
-
Net income was improving every quarter, and the biggest expense,
"Selling general, and administrative" was holding steady around $4
million each quarter.
- On twitter, I found a mention of
their earnings conference call and some things discussed in it. Instead
of taking the tweeter's word for it, I found it and listened for myself.
- The conference call discussed how the remainder of their convertible debt had been eliminated.
-
The presentation slides discussed how distribution channels increasing
was why revenues were increasing. This was another reason not to think it was just a
"lucky quarter."
- The conference call discussed plans to uplist to a major exchange late this year
Hopefully, by now you can understand a bit of why I was impressed. This
was nothing like the 99% of the OTC trash I usually trade, this was a
real company with real things going on, breaking to new multi-year
highs. But I didn't drink the kool-aid yet; there still was one thing that concerned me, the market cap valuation.
For
those unfamiliar with this term, market cap is calculated by multiplying the number of
shares outstanding by the price of the stock. That's an easy enough
number to find, great. But what do you do with it? When I saw that CVSI
had a market cap of just over $90 million, what should that mean to me? I
don't know how to decide whether that valuation is "fair" or not. So
rather than stressing about that question, I took another approach. I
decided to see how it stacked up compared to other marijuana stocks in
the sector, based off of their most recent quarterly report that I could
find. For the sake of simplicity, I ignored Canadian companies (didn't
feel like doing currency conversions) and also ignored stocks under
$.10, as I figured their market caps would fluctuate too wildly to be
useful. Below is the (almost certainly incomplete) table I came up with
(share prices as of 5/17/18, to show what I was looking at early in the
run):

I found it very interesting to examine
how the market caps of all these stocks related to a few basic
fundamental areas, as I'd never really stopped to consider a sector like
this before. There certainly were a few wacky ones (looking at you
BUDZ), and I was surprised at how few of these companies I've seen run in
the past actually have meaningful revenues. At the time, CVSI ranked
14th out of 35 stocks tracked, with a
$93,227,360
market cap. But how did it compare in the other areas? CVSI was #3 in
revenues. It was #1 in net income. It was #5 in both total assets and
S/E. Yet its market cap was only 14th? That seemed wrong to me.
I really
didn't want to say where CVSI "deserved" to be as I'm not qualified or
knowledgeable enough to make that kind of assessment, but I certainly
could use these comparisons to help guide my thinking as to what might be possible. In terms
of revenue, CVSI compared most closely to the top 6 stocks on the list
(except you BUDZ, sorry), and was half the market cap of the lowest one,
TRTC.
Maybe all of these were just overvalued. But since none of them were in
the midst of big parabolic runs, it seemed to me like their market caps
should hold fairly stable at those levels for a while - meaning CVSI
potentially had some catching up to do, in a technical situation where a
parabolic spike certainly was possible.
Putting It All Together:
So
what does the complete picture look like here? One of the strongest stocks fundamentally
in the marijuana sector, with a much cheaper market cap
than anything comparable, trading in a sector that has a history of
large runs, no share dilution going on, in the midst of a technical
breakout, and possibly uplisting at the end of the year. What's not to
like? So I piled in on the long side, and the break above the $1.12
level made it VERY easy to stay patient and see just how far the run
could go. I would have held months if I'd had to. If there was a sudden
negative news event or the breakout just randomly failed, I would only
be losing unrealized profits. Given the potential I saw, that risk was
more than worth it, to really give the chart a chance to run.
I'd
like to give a quick shoutout to @MarxistTrader, who absolutely killed
CVSI as well, posting a verified profit that dwarfs mine! I'd also like
to thank @OddStockTrader, because I had a few discussions with him about CVSI
that really helped me to stay patient. I know he had a great patience trade
on CVSI too. Both of these guys found CVSI well before I did and were
in it from much lower! Excellent research and conviction!
Trades
like CVSI don't come around often, but when they do, preparation and
experience are always key. Without spending the time outside of market hours to
read the filings, make my comparisons table, or scour message boards for
anything useful, I'd have never recognized this opportunity. As far as
experience is concerned, I've had years of experience trading marijuana
stocks to help me trade CVSI's technical action and to recognize that,
fundamentally, it wasn't just another garbage pump that could go to zero
on me. These are the trades worth showing up to the market every day
for. Hopefully, the market doesn't keep us waiting too long for the next
one!
Disclosure: No current CVSI position, but I plan to trade CVSI again in the future, both long and short.